Posts

Nifty Intraday Reversal Timings for 10/07/2023

  Nifty Intraday Reversal Timings for 10/07/2023  9:17 10:04 10:51 11:38 12:25 13:12 13:59 14:46 Check the high and low of 5 min candle at reversal timings, if the price breaks high reversal is upside and valid until next reversal time. similar on the down side, if the price brakes low reversal is down and valid until next reversal time.

Notes on Retracement Theory in Markets

 When the retracement of a rally is shallow, it indicates a stronger opinion of the shorter timeframe traders versus the opinion of the longer-term traders. Alternatively, if the longer time frame traders agree with the shorter timeframe traders (that the market is ultimately heading higher), they stand aside rather than fading the previous rally knowing that the 5-minute Bulls will exhaust themselves and prices will retrace. This is when they look to enter the market. If the price of com retraces less than 33% of the prior rally, then we could say that the 5-minute Bulls are stronger and/or the 15-minute traders agree with the shorter-term timeframe opinion. Should the Bears push the retracement to 50% or more, the 5-minute traders are probably being overpowered by a more powerful longer timeframe. Should the retracement be more than 66%, the traders in the shorter timeframe that caused the price movement would be in trouble When looking at a price chart, it is readily apparent that p

BankNifty Analysis using OI Pulse for 10-Jan-2022

Image
  Bank Nifty Future in January series is showing Long Build up. Positive BIG OI shows some unwinding at 3:15 to 320 on call is negative. 320 Strategy shows on Call Side. Positive  Participant wise OI shows side ways trend  OI Chart .. IV is more on PUT side. 38000 is the crucial level

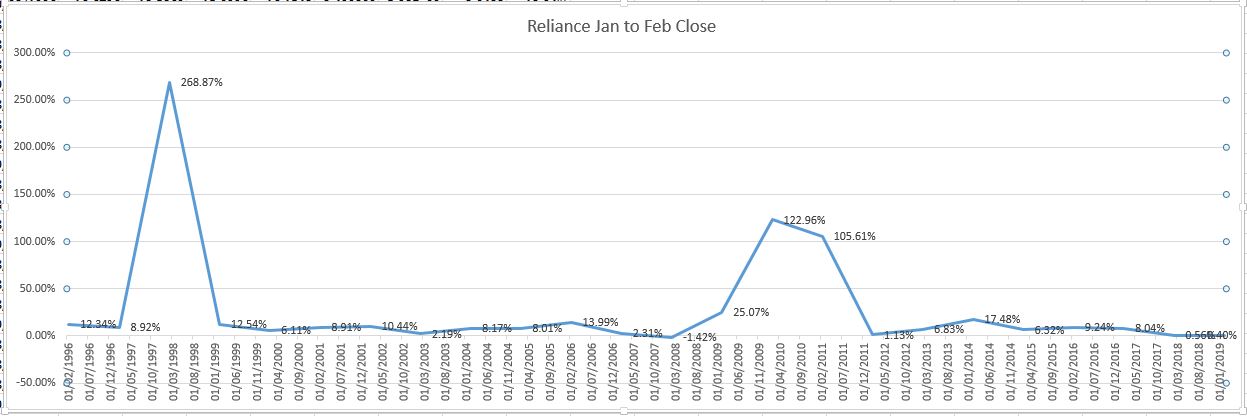
RELIANCE HISTORICAL FEBRUARY MOVEMENTS FROM JANUARY CLOSE

Image
The above chart shows the percentage move from January close to February high. Reliance showed a negative result only once i.e during the 2008 market lows.

Astrology ruler signs for important countries excerpts from Sepharial book

Aries: England, Denmark, Judea, Peru, Germany. Taurus: Ireland, Persia, Italy, Chili. Gemini: Wales, United States of America, Egypt. Cancer: China, Holland, Africa. Leo: France, Australia. Virgo: Turkey, Uruguay. Libra: Argentine Republic, Japan, Austria. Scorpio: Morocco, Brazil. Sagittarius: Spain. Capricorn: India, New Zealand, Mexico. Aquarius: Russia. Pisces: Portugal. Effects of Major planets. Neptune produces democratic disturbances, anarchy, chaos, confusion. It tends to schemes and plots, “rings” and rigging of the markets. Uranus produces sudden upheavals, revolutions, strikes and insurrections. It brings about sudden fluctuations in values, and has a disturbing effect on securities. Saturn brings famines, failure of crops, disasters of various sorts and national depression due to political reverses and general want or popular discontent. Its effect on the market is to produce a marked depression or deflation of security values. Jupiter

W.D Gann Methods: Important Resistance Points

mportant Resistance points(Support and resistance) as per Gann Methods. Angles from Tops and Bottoms Angles running Horizontally Vertical Angles or time periods ending major or minor cycles The crossing of important angles starting from “0”  at time at top or breaking of angles starting from “0” at bottom. The crossing or coming together  of angles from double or triple bottoms or double or triple tops. The crossing of double or triple tops or breaking of double or triple bottoms. Resistance points in the past movement of an individual stock. Volume of sales Squaring of Time and Price. The more confirmations you get at the same point, the stronger, the resistance and the safer it is to trade, but never overlook the value of the Time factor and the Main forecast.